Information
 The Data represented on this site cannot be used without the prior permission of the sites author. Neither can the Data displayed here be used as valid Data for the purpose of submitting to the Met office or any other official recording organization. Any Data found to be used in this manner will be reported to the publication concerned and asked to be removed.
The following equipment is used to collect data at this site. i) Stevenson Screen. ii) Max Thermometer. iii) Min Thermometer. iv) Dry Bulb and a Wet Bulb. v) Soil Thermometer. vi) Barometer. vii) Rain Gauges Daily. viii) Davis Wireless VP2. ix) VP2 Console x2. x) Vantuge Vue Console xi) Wireless Leaf Moisture and Soil Temperature Station.
Sensors included Wind Speed (Max Gust, Average), Wind Chill, Inside and Outside temp. Humidity inside and Out, Rainfall, Barometer, Solar Radiation, UV. Soil Moisture, Leaf Wetness, Soil Temperature, Sun temperature and grass min.
Live Data is collected by a data logger which is download to a PC via serial port using Weather Link software version 6.0.4 which is provided by Davis Weather Instruments. Other software used is Sandysoft Cumulus which provides the live data while the Twitter feed is supplied by Weather Display Software.
The web cam has been removed due to tree growth so effectively there's nothing too see any longer. Lightening detection is provided by a Boltek LD-350 Detector and Astrogenic Nextstorm 1.9 software, Live Lightning display by Astrongenic’s Stormvue ngx.
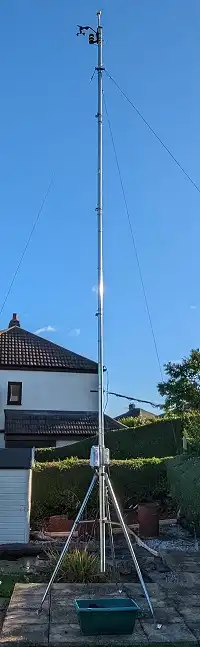
The picture to the right shows the mast hosting both the analogue and sonic anemometer. The mast is secured by steel guide ropes and five foot tripod bought in from America.
The tables below show the following information. The station location, number, File location.
The 30 year Rainfall averages to present
The 30 year temperature averages from 1961 to present
The wind speed averages from 2000
The final table shows the temperature definitions as used by the Met Office. However forecasters at times may use the terms "warm", "Cold", "Mild" in descriptive manner where necessary e.g Feeling very cold in the northerly breeze or feeling milder than of late. Note that the seasons are not the Astronomically definitions of the seasons. Therefore Winter is December to February, Spring is March to May, Summer June to August and September September to November.
Station Location and Averages
| Station Location | |
|---|---|
| Latitude | 53.21.02 Degrees North |
| Longitude | 1.28 Degrees West |
| Altitude | 160.02 Metres |
| Station Number | 39-0827529 |
| File Ref Number | 23296/58 |
| Rainfall 30 Years Averages | ||||
|---|---|---|---|---|
| Month | Rainfall | Rainfall | Rainfall | Rainfall |
| Years | 1961 - 1990 | 1971 - 2000 | 1981 - 2010 | 1991 - 2020 |
| Jan | 86.1mm | 85.8mm | 81.0mm | 74.4mm |
| Feb | 65.3mm | 62.7mm | 60.1mm | 65.2mm |
| Mar | 72.1mm | 68.8mm | 63.7mm | 60.6mm |
| Apr | 65.5mm | 63.5mm | 63.2mm | 56.1mm |
| May | 61.9mm | 56.3mm | 57.7mm | 59.6mm |
| Jun | 62.6mm | 67.8mm | 71.0mm | 76.9mm |
| Jul | 52.8mm | 49.5mm | 57.0mm | 63.9mm |
| Aug | 66.7mm | 63.7mm | 66.1mm | 68.8mm |
| Sep | 63.2mm | 64.9mm | 65.4mm | 65.8mm |
| Oct | 68.3mm | 75.7mm | 82.8mm | 82.8mm |
| Nov | 77.1mm | 76.6mm | 79.4mm | 88.3mm |
| Dec | 82.9mm | 91.5mm | 86.9mm | 87.5mm |
| Total | 824.5mm | 826.8mm | 836.3mm | 849.9mm |
| Temperature 30 Years Averages 1961 - 1990, 1971 - 2000 | ||||||
|---|---|---|---|---|---|---|
| Month | Ave Temp | Ave Max | Ave Min | Ave Temp | Ave Max | Ave MIn |
| Years | 1961 - 1990 | 1961 - 1990 | 1961 - 1990 | 1971 - 2000 | 1971 - 2000 | 1971 - 2000 |
| Jan | 3.4C | 5.6C | 1.3C | 3.8C | 6.3C | 1.4C |
| Feb | 3.6C | 6.3C | 0.9C | 4.0C | 6.9C | 1.2C |
| Mar | 5.2C | 8.3C | 2.1C | 5.9C | 9.2C | 2.6C |
| Apr | 7.6C | 11.3C | 3.8C | 7.8C | 11.8C | 3.9C |
| May | 10.9C | 15.2C | 6.7C | 11.6C | 16.5C | 6.7C |
| Jun | 14.0C | 18.3C | 9.6C | 14.0C | 18.3C | 9.6C |
| Jul | 15.8C | 19.9C | 11.6C | 16.4C | 20.9C | 11.9C |
| Aug | 15.5C | 19.4C | 11.6C | 16.0C | 20.4C | 11.7C |
| Sep | 13.2C | 16.7C | 9.6C | 13.4C | 17.1C | 9.6C |
| Oct | 10.1C | 13.1C | 7.2C | 10.0C | 13.1C | 6.8C |
| Nov | 6.1C | 8.5C | 3.7C | 6.2C | 8.5C | 3.9C |
| Dec | 4.4C | 6.5C | 2.2C | 4.8C | 7.1C | 2.4C |
| Total | 9.1C | 12.4C | 5.9C | 9.5C | 13.0C | 6.0C |
| Temperature 30 Years Averages 1981 - 2010, 1991 - 2020 | ||||||
|---|---|---|---|---|---|---|
| Month | Ave Temp | Ave Max | Ave Min | Ave Temp | Ave Max | Ave MIn |
| Years | 1981 - 2010 | 1981 - 2010 | 1981 - 2010 | 1991 - 2020 | 1991 - 2020 | 1991 - 2020 |
| Jan | 4.2C | 6.9C | 1.5C | 4.4C | 7.1C | 1.7C |
| Feb | 4.2C | 7.3C | 1.2C | 4.8C | 7.8C | 1.7C |
| Mar | 6.4C | 9.9C | 2.8C | 6.4C | 10.2C | 2.7C |
| Apr | 8.4C | 12.7C | 4.1C | 8.8C | 13.3C | 4.4C |
| May | 11.8C | 16.5C | 7.1C | 12.0C | 16.7C | 7.2C |
| Jun | 14.5C | 19.1C | 9.9C | 14.7C | 19.3C | 10.1C |
| Jul | 16.6C | 21.3C | 12.0C | 16.8C | 21.6C | 12.1C |
| Aug | 16.3C | 20.8C | 11.8C | 16.4C | 21.0C | 11.9C |
| Sep | 13.7C | 17.7C | 9.7C | 14.0C | 18.1C | 9.8C |
| Oct | 10.2C | 13.6C | 6.9C | 10.4C | 13.8C | 7.0C |
| Nov | 6.8C | 9.5C | 4.1C | 7.0C | 9.8C | 4.3C |
| Dec | 4.5C | 7.1C | 2.0C | 4.8C | 7.4C | 2.2C |
| Total | 9.8C | 13.5C | 6.0C | 10.0C | 13.8C | 6.3C |
| Average Wind Speed and 2000 Onwards | ||
|---|---|---|
| Month | Average Wind Speed | Average Gust |
| Years | 2000 Onwards | 2000 Onwards |
| Jan | 8.4 MPH | 30.4 MPH |
| Feb | 7.9 MPH | 29.3 MPH |
| Mar | 7.3 MPH | 27.5 MPH |
| Apr | 6.1 MPH | 25.1 MPH |
| May | 5.9 MPH | 24.5 MPH |
| Jun | 4.8 MPH | 22.3 MPH |
| Jul | 4.6 MPH | 22.3 MPH |
| Aug | 4.8 MPH | 23.1 MPH |
| Sep | 4.8 MPH | 22.7 MPH |
| Oct | 6.1 MPH | 25.3 MPH |
| Nov | 7.1 MPH | 27.1 MPH |
| Dec | 7.8 MPH | 28.9 MPH |
| Total | 6.4 MPH | 25.9 MPH |
| Met Office Temperature Definitions | ||||
|---|---|---|---|---|
| Difference from Average | Spring | Summer | Autumn | Winter |
| Degrees C | March to May | June to August | September to November | December to February |
| +6C to ≥ +7C | Very Warm | Hot to Very Hot | Very Mild | Exceptionally Mild |
| +4C to +5C | Warm | Very Warm | Mild | Very Mild |
| +2C to +3C | Rather Warm | Warm | Rather Mild | Mild |
| -1C to +1C | Normal | Normal | Normal | Normal |
| -2C to -3C | Rather Cold | Rather Cool | Rather Cold | Rather Cold |
| -4C to -5C | Cold | Cool | Cold | Cold |
| Below -5C | Very Cold | Very Cold or Cold | Very Cold | Very Cold |